Grouped Dynamic Report
Grouped Dynamic Report
We will now change the report in two ways. We will make it dynamic, and we will add some Grouping Levels. Keep in mind that these two are independent. The Grouping Levels could have been added to the static report in the last section.
Step 1: Start the Report Wizard
On the main Base window, click the Reports icon and then click Use Wizard to Create Report.
Step 2: Choose the fields from the View
Choose the View you want to use from the Tables or queries dropdown list. The available fields will be listed. Use the >> button to move all of them to the Fields in report list. Click Next .
Step 3: Labeling the fields
Here you can modify the field labels from their default values. We will remove the underscores from the field names and add spaces so that Sale_Year becomes Sale Year and LastName becomes Last Name. Click Next .
Step 4: Grouping levels
Use the > button to move the Sale_Year and Sale_Month, in that order, from the Fields to the Groupings column. Click Next .
Step 5: Sort options
Note that Sale_Year and Sale_Month are now listed as sort fields. Click Next .
Step 6: Choose layout
We will keep the defaults but, as mentioned in the previous section, you can try many alternatives. Click Next .
Step 7: Create report
Set the name of the report file, choose Dynamic report and Create report now. Click Finish .
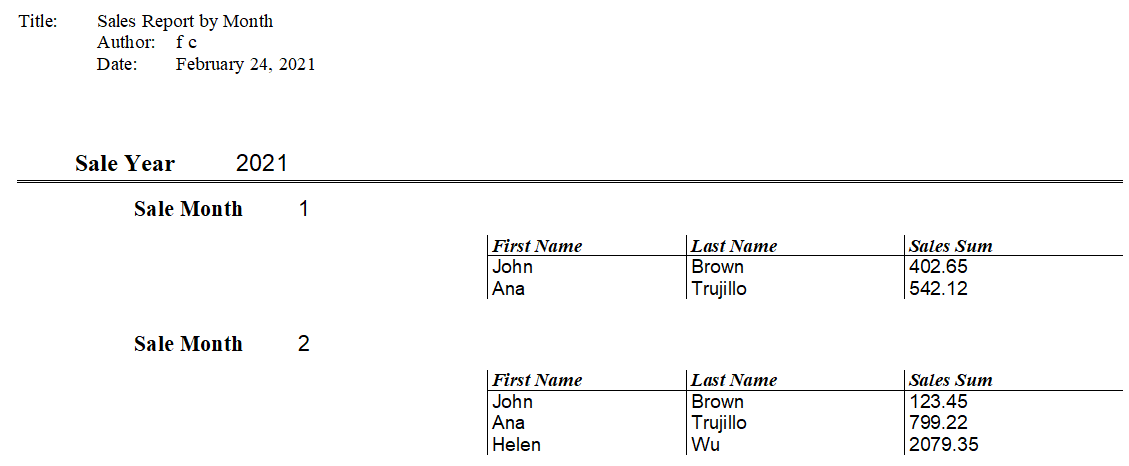
The top part of the report looks much like Figure 200, but the data table now has a hierarchical structure with the year being the outermost category, then the month and then the data for each person's monthly sales in a table.
The report layout can be edited by closing the report then right-clicking on its icon and selecting Edit. The report will appear filled with dummy data. The Title field can be populated by selecting the menu File → Properties and filling out the Title on the Description tab. The Author field is taken from Tools → Options → OpenOffice → User Data → First/Last name. The date format in the header area can be adjusted by right-clicking on it and selecting Fields. A dialog with a long list of formats will appear. Choose one then click OK . In the data table, the column widths can be adjusted by hovering the cursor over a border until it becomes a double-headed arrow then clicking and dragging it left or right.
When you are done changing the format, save the document and also save the main Base document. If you double-click on the report now, you will see the format changes along with the actual data from the View. Compare Figure 201 to Figure 200 to see the effect of the groupings by the Sale Year and Sale Month. Remember that the grouping could have been done in the static report. Since this report is dynamic, if data is added or deleted from the People and Sales tables, the report will reflect the changes.

| Content on this page is licensed under the Creative Common Attribution 3.0 license (CC-BY). |