Adding Pictures, Tables, Charts, Media Files, and Other Objects
- What is Impress?
- Starting Impress
- The main Impress window
- Workspace views
- Creating a new presentation
- Formatting a presentation
- Adding and formatting text
- Adding pictures, tables, charts, media files, and other objects
- Working with master pages and styles
- Adding comments to a presentation
- Setting up the slide show
- Running a slide show
Adding Pictures, Tables, Charts, Media Files, and Other Objects
As we have seen, in addition to text, a contents box can contain also pictures, tables, charts, and movies. This section provides a quick overview of how to work with these objects; for a more detailed description, you are invited to consult the Impress Guide.
Adding Pictures
To add a picture to a contents box:
- Go to Insert → Picture on the main menu bar and then select either From file or Scan.
- Alternatively, and after inserting a new slide, click the Insert Picture icon
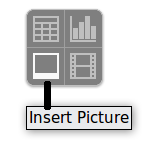
and select the file from the Insert Picture dialog that opens. To see a preview of the picture, check Preview at the bottom of the Insert Picture dialog (Figure 126).

- Move the picture to the desired location.
The picture will resize itself to fill the area with the contents box. Follow the directions in the Caution note below when manually resizing a graphic.

| When resizing a graphic, right-click the picture. Select Position and Size from the context menu and make sure that Keep ratio is selected. Then adjust the height or width to the size you need. (As you adjust one dimension, both dimensions will change.) Failure to do so will cause the picture to become distorted. Remember also that resizing a bitmap image will reduce its quality; it is better to create an image of the desired size outside of Impress. |
Adding Tables
For displaying tabular data, you can insert basic tables directly into your slides by choosing the Table contents type. It is also possible to add a table outside a contents box in a number of ways:
- Go to Insert → Table on the main menu bar.
- Click on the Table icon
 on the main toolbar or table toolbar.
- After inserting a new slide, click the Insert Table icon.
- Alternatively, click on the Table Design icon
 on the table toolbar to open the Table Design section of the Tasks pane and then select a style.
The first three methods above opens the Insert Table dialog, where you can select the required number of columns and rows. Alternatively, clicking on the black arrow next to the Table icon displays a graphic allowing you to drag and select the number of required rows and columns for your table.

| Creating a table will cause the Properties deck of the Sidebar to display a Table Design panel where several table features can be set conveniently. |
With the table selected, the Table toolbar should appear. If it does not, you can access it by selecting View → Toolbars → Table. The Table toolbar offers many of the same icons as the table toolbar in Writer, except for functions like Sort and Sum for performing calculations. For those functions, you need to use a spreadsheet inserted from Calc (discussed below).
After the table is created, you can modify it in much the same way as you would modify a table in Writer: adding and deleting rows and columns, adjusting width and spacing, adding borders, background colors and so on. Detailed information on working with tables and the Table Properties dialog can be found in Chapter 3 of the Impress Guide and Chapter 9 of the Writer Guide.
By modifying the style of the table from the Table Design section of the Sidebar, you can quickly change the appearance of the table or any newly created tables based on the Style options you select. You can choose to add emphasis to a header and total row as well as the first and last columns of the table, and apply a banded appearance to the rows and columns.
Having completed the table design, entering data into the cells is similar to working with text box objects. Click in the cell you wish to add data to, and begin typing. To move around cells quickly, use the following key options:
- The arrow keys move the cursor to the next table cell if the cell is empty, otherwise they move the cursor to the next character in the cell.
- The Tab key moves to the next cell, skipping over the contents of the cell; ⇧ Shift + Tab ⇆ move backwards from cell to cell.
Adding Charts
To insert a chart in a slide you can either use Insert → Chart from the main menu bar, clicking on the Chart icon ![]() in the main toolbar, or, after inserting a new slide, clicking on the Insert Chart icon. Impress will insert a default chart. To modify the chart type, insert your own data and change the formatting, right-click on the chart and select Chart Type or Chart Data Table. Refer to the Impress Guide for more details.
in the main toolbar, or, after inserting a new slide, clicking on the Insert Chart icon. Impress will insert a default chart. To modify the chart type, insert your own data and change the formatting, right-click on the chart and select Chart Type or Chart Data Table. Refer to the Impress Guide for more details.
Adding Media Files
You can insert various types of media files, such as music and movie clips, into your slide by selecting the Insert Movie icon in an empty contents box. A media player will open at the bottom of the screen, and you can preview the media. When an audio file is inserted, the contents box will show a loudspeaker image.
| In Linux-based systems such as Ubuntu, media files do not work straight out of the box. You need to download the Java Media Framework API (JMF) and add the path to jmf.jar to the Class Path in Tools → Options → OpenOffice → Java. |
Adding Graphics, Spreadsheets, and Other Objects
Graphics, such as shapes, callouts, arrows, and so on, are often useful to complement the text on a slide. These objects are handled much the same way as graphics in Draw. For more information, see Chapter 6 (Getting Started with Draw) in this book, the Draw Guide, or Chapters 4, 5, and 6 in the Impress Guide.
Spreadsheets embedded in Impress include most of the functionality of spreadsheets in Calc and are therefore capable of performing extremely complex calculations and data analysis. If you need to analyze your data or apply formulas, these operations are best performed in a Calc spreadsheet and the results displayed in an embedded Impress spreadsheet or even better in a native Impress table.
Alternatively, choose Insert → Object → OLE Object → OpenOffice Spreadsheet from the menu bar. This opens a spreadsheet in the middle of the slide and the menus and toolbars change to those used in Calc so that you can start adding data, though you may first need to resize the visible area on the slide. You can also insert an already existing spreadsheet and use the viewport to select the data that you want to display on your slide.
Impress offers the capability of inserting in a slide various other types of objects such as Writer documents, Math formulas, or even another presentation. For details on using these objects, refer to Chapter 7 of the Impress Guide.
| Content on this page is licensed under the Creative Common Attribution 3.0 license (CC-BY). |