Common Parts of all Chart Types
Diagram
The diagram object is an important object of a chart document. The diagram represents the visualization of the underlying data. The diagram object is a graphic object group that lies on the same level as the titles and the legend. From the diagram, data rows and data points are obtain that are also graphic objects that represent the respective data. Several properties can be set at a diagram to influence its appearance. Note that the term data series is used instead of data rows.
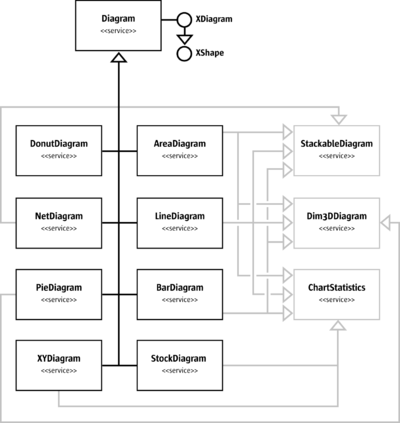
Some diagrams support the service com.sun.star.chart.Dim3DDiagram that contains the property Dim3D. If this is set to true, you get a three-dimensional view of the chart, which in Apache OpenOffice is usually rendered in OpenGL. In 3-D charts, you can access the z-axis, which is not available in 2-D.
The service com.sun.star.chart.StackableDiagram offers the properties Percent and Stacked. With these properties, accumulated values can be stacked for viewing. When setting Percent to true, all slices through the series are summed up to 100 percent, so that for an AreaDiagram the whole diagram space would be filled with the series. Note that setting the Percent property also sets the Stacked property, because Percent is an addition to Stacked.
There is a third service that extends a base diagram type for displaying statistical elements called com.sun.star.chart.ChartStatistics. With this service, error indicators or a mean value line are added. The mean value line represents the mean of all values of a series. The regression curve is only available for the XYDiagram, because a numeric x-axis, is required.
The illustration above shows that there are eight base types of diagrams. The three services, StackableDiagram, Dim3DDiagram and ChartStatistics are also supported for several diagram types and allows extensions of the base types as discussed. For instance, a three-dimensional pie chart can be created, because the com.sun.star.chart.PieDiagram service points to the com.sun.star.chart.Dim3DDiagram service.
The services com.sun.star.chart.AreaDiagram, com.sun.star.chart.LineDiagram, and com.sun.star.chart.BarDiagram support all three feature services.
Axis
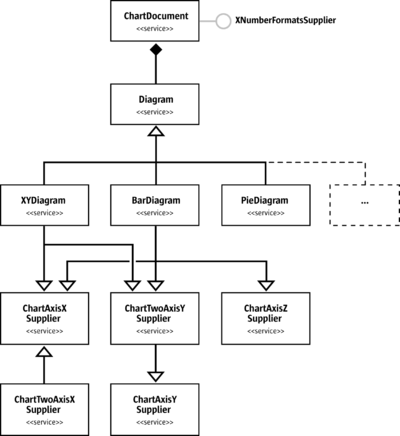
All charts can have one or more axis, except for pie charts. A typical two-dimensional chart has two axis, an x- and y-axis. Secondary x- or y-axis can be added to have up to four axis. In a three-dimensional chart, there are typically three axis, x-, y- and z-axis. There are no secondary axis in 3-dimensional charts.
An axis combines two types of properties:
- Scaling properties that affect other objects in the chart. A minimum and maximum values are set that spans the visible area for the displayed data. A step value can also be set that determines the distance between two tick-marks, and the distance between two grid-lines if grids are switched on for the corresponding axis.
- Graphical properties that influence the visual impression. These are character properties (see com.sun.star.style.CharacterProperties) affecting the labels and line properties (see com.sun.star.drawing.LineProperties) that are applied to the axis line and the tick-marks.
Different diagram types support a different number of axis. In the above illustration, a com.sun.star.chart.XYDiagram, also known as a scatter diagram, is shown. The scatter diagram supports x- and y-axis, but not a z-axis as there is no 3-dimensional mode. The com.sun.star.chart.PieDiagram supports no axis at all. The com.sun.star.chart.BarDiagram supports all kinds of axis. Note that the z-Axis is only supported in a three-dimensional chart. Note that there is a com.sun.star.chart.ChartTwoAxisXSupplier that includes the com.sun.star.chart.ChartAxisXSupplier and is supported by all diagrams in OpenOffice.org required to support the service ChartAxisXSupplier.
The following example shows how to obtain an axis and how to change the number format.
  import com.sun.star.chart.*;
  import com.sun.star.beans.XPropertySet;
  import com.sun.star.util.XNumberFormatsSupplier;

  ...

  // class members
  XChartDocument aChartDocument;
  XDiagram aDiagram;

  ...

  // get an XChartDocument and assign it to aChartDocument
  // get the diagram from the document and assign it to aDiagram
  // ...

  // check whether the current chart supports a y-axis
  XAxisYSupplier aYAxisSupplier = (XAxisYSupplier) UnoRuntime.queryInterface(
      XAxisYSupplier.class, aDiagram);

  if (aYAxisSupplier != null) {
      XPropertySet aAxisProp = aYAxisSupplier.getYAxis();

      // initialize new format with value for standard
      int nNewNumberFormat = 0;

      XNumberFormatsSupplier aNumFmtSupp = (XNumberFormatsSupplier)
          UnoRuntime.queryInterface(XNumberFormatsSupplier.class,
              aChartDocument);

      if (aNumFmtSupp != null) {
          com.sun.star.util.XNumberFormats aFormats = aNumFmtSupp.getNumberFormats();

          Locale aLocale = new Locale("de", "DE", "de");

          String aFormatStr = aFormats.generateFormat(
              0,        // base key
              aLocale,  // locale
              true,     // thousands separator on
              true,     // negative values in red
              (short)3, // number of decimal places
              (short)1  // number of leading ciphers
          );

          nNewNumberFormat = aFormats.addNew(aFormatStr, aLocale);
      }

      aAxisProp.setPropertyValue("NumberFormat", new Integer(nNewNumberFormat));
  }
Data Series and Data Points
The objects that visualize the actual data are data series. The API calls them data rows that are not rows in a two-dimensional spreadsheet table, but as sets of data, because the data for a data row can reside in a column of a spreadsheet table.
The data rows contain data points. The following two methods at the com.sun.star.chart.XDiagram interface allow changes to the properties of a whole series or single data point:
  com::sun::star::beans::XPropertySet getDataRowProperties( [in] long nRow)
  com::sun::star::beans::XPropertySet getDataPointProperties( [in] long nCol,
                                                              [in] long nRow)
The index provided in these methods is 0-based, that is, 0 is the first series. In XYDiagrams, the first series has an index 1, because the first array of values contains the x-values of the diagram that is not visualized. This behavior exists for historical reasons.
In a spreadsheet context, the indexes for getDataPointProperties() are called nCol and nRow and are misleading. The nRow parameter gives the data row, that is, the series index. The nCol gives the index of the data point inside the series, regardless if the series is taken from rows or columns in the underlying table. To get the sixth point of the third series, write getDataPointProperties(5, 2).
Data rows and data points have com.sun.star.drawing.LineProperties and com.sun.star.drawing.FillProperties. They also support com.sun.star.style.CharacterProperties for text descriptions that can be displayed next to data points.
Properties can be set for symbols and the type of descriptive text desired. With the SymbolType property, one of several predefined symbols can be set. With SymbolBitmapURL, a URL that points to a graphic in a format known by Apache OpenOffice can be set that is then used as a symbol in a com.sun.star.chart.LineDiagram or com.sun.star.chart.XYDiagram.
The following example demonstrates how to set properties of a data point. Before implementing this example, create a chart document and diagram of the type XYDiagram.
  com.sun.star.chart.XChartDocument aChartDocument;
  com.sun.star.chart.XDiagram aXYDiagram;

  // get a chart document and assign it to aChartDocument
  // set an "XYDiagram" and remember the diagram in aXYDiagram
  // ...

  // get the properties of the fifth data point of the first series
  // note that index 1 is the first series only in XYDiagrams
  try {
      com.sun.star.beans.XPropertySet aPointProp = maDiagram.getDataPointProperties(4, 1);
  } catch (com.sun.star.lang.IndexOutOfBoundsException ex) {
      System.out.println("Index is out of bounds: " + ex);
      System.exit(0);
  }

  try {
      // set a bitmap via URL as symbol for the first series
      aPointProp.setPropertyValue("SymbolType", new Integer(ChartSymbolType.BITMAPURL));
      aPointProp.setPropertyValue("SymbolBitmapURL",
          "http://graphics.openoffice.org/chart/bullet1.gif");

      // add a label text with bold font, bordeaux red 14pt
      aPointProp.setPropertyValue("DataCaption", new Integer(ChartDataCaption.VALUE));
      aPointProp.setPropertyValue("CharHeight", new Float(14.0));
      aPointProp.setPropertyValue("CharColor", new Integer(0x993366));
      aPointProp.setPropertyValue("CharWeight", new Float(FontWeight.BOLD));
  } catch (com.sun.star.uno.Exception ex) {
      System.out.println("Exception caught: " + ex);
  }
| Content on this page is licensed under the Public Documentation License (PDL). |

