Difference between revisions of "Chart2/Features2.3"
Tonygalmiche (Talk | contribs) |
B michaelsen (Talk | contribs) |
||
| (29 intermediate revisions by 2 users not shown) | |||
| Line 1: | Line 1: | ||
| − | = | + | = Simplified creation of charts with a new Chart Wizard ( former Autoformat Chart Dialog) = |
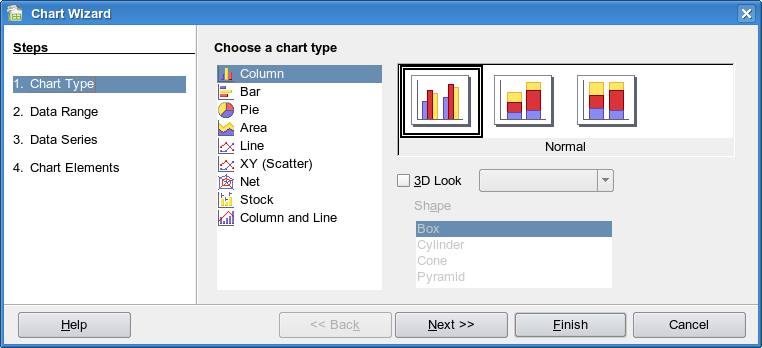
| + | Description : The chart creation procedure has been simplified to take less steps. The chart is positioned automatically and serves as live preview. A new wizard offers to select the chart type as first user action. The type can be selected on a single page. There is no need to switch between pages or scroll around anymore. The chart type dialog has been replaced thus it now equals the new first wizard page. | ||
| + | |||
| + | [[Image:Chart2_NewWizard.png]] | ||
| − | |||
| − | |||
* Issue : [http://www.openoffice.org/issues/show_bug.cgi?id=20344 20344] | * Issue : [http://www.openoffice.org/issues/show_bug.cgi?id=20344 20344] | ||
| − | |||
* Feature Announcement : http://graphics.openoffice.org/servlets/ReadMsg?listName=features&msgNo=164 | * Feature Announcement : http://graphics.openoffice.org/servlets/ReadMsg?listName=features&msgNo=164 | ||
* Specification : http://specs.openoffice.org/chart/wizards/ChartWizard.odt | * Specification : http://specs.openoffice.org/chart/wizards/ChartWizard.odt | ||
| Line 10: | Line 10: | ||
* CWS : [http://eis.services.openoffice.org/EIS2/cws.ShowCWS?Path=SRC680%2Fchart2mst3 chart2mst3] integrated in SRC680m212 | * CWS : [http://eis.services.openoffice.org/EIS2/cws.ShowCWS?Path=SRC680%2Fchart2mst3 chart2mst3] integrated in SRC680m212 | ||
| + | = Flexible source ranges = | ||
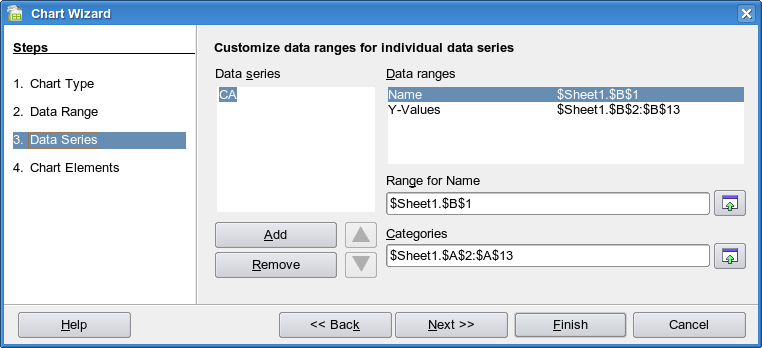
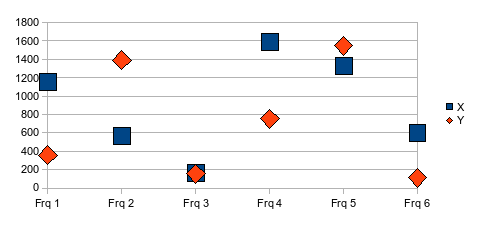
| + | Description : It is possible now to choose separate data ranges for each series. You can even select different x-values for different series. | ||
| + | |||
| + | [[Image:Chart2_FlexibleSourceRange.png]] | ||
| − | |||
| − | |||
* Issue : [http://www.openoffice.org/issues/show_bug.cgi?id=3997 3997] | * Issue : [http://www.openoffice.org/issues/show_bug.cgi?id=3997 3997] | ||
| − | |||
* Feature Announcement : http://graphics.openoffice.org/servlets/ReadMsg?list=features&msgNo=165 | * Feature Announcement : http://graphics.openoffice.org/servlets/ReadMsg?list=features&msgNo=165 | ||
* Specification : http://specs.openoffice.org/chart/dataselection/FlexibleSourceRangeSelection.odt | * Specification : http://specs.openoffice.org/chart/dataselection/FlexibleSourceRangeSelection.odt | ||
| Line 20: | Line 21: | ||
* CWS : [http://eis.services.openoffice.org/EIS2/cws.ShowCWS?Path=SRC680%2Fchart2mst3 chart2mst3] integrated in SRC680m212 | * CWS : [http://eis.services.openoffice.org/EIS2/cws.ShowCWS?Path=SRC680%2Fchart2mst3 chart2mst3] integrated in SRC680m212 | ||
| + | = Show formula and r^2 value of regression curve in status bar and quick help = | ||
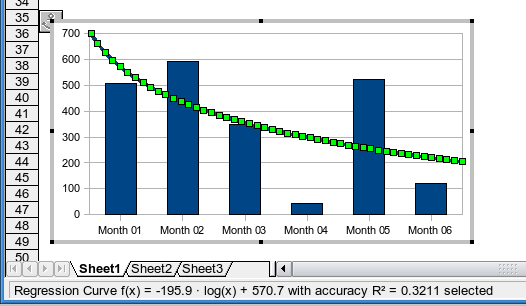
| + | Description : When a regression curve in a chart is selected, the status bar now shows the formula and the square of correlation coefficient R in the status bar. The same string is also used for quick help, but only in the extended version (see Tools/Options/%PRODUCTNAME/General for switching that on) | ||
| − | + | [[Image:Chart2_FormulaRegressionCurve.png]] | |
| − | + | ||
| − | + | ||
| − | + | ||
| − | + | ||
| − | + | ||
| − | + | ||
| + | * Issue : [http://www.openoffice.org/issues/show_bug.cgi?id=78442 78442] | ||
| + | * Feature Announcement : http://graphics.openoffice.org/servlets/ReadMsg?list=features&msgNo=185 | ||
| + | * Specification : http://specs.openoffice.org/chart/ChartObjectNames.odt | ||
| + | * Test case specification : http://www.openoffice.org/nonav/issues/showattachment.cgi/46250/regression_curves.html | ||
| + | * CWS : [http://eis.services.openoffice.org/EIS2/cws.ShowCWS?Path=SRC680%2Fchart06 chart06] integrated in SRC680m219 | ||
| − | |||
| − | |||
| − | |||
| − | |||
| − | |||
| − | |||
| − | |||
| + | = Simplify and correct the 3D-Effects dialog for charts = | ||
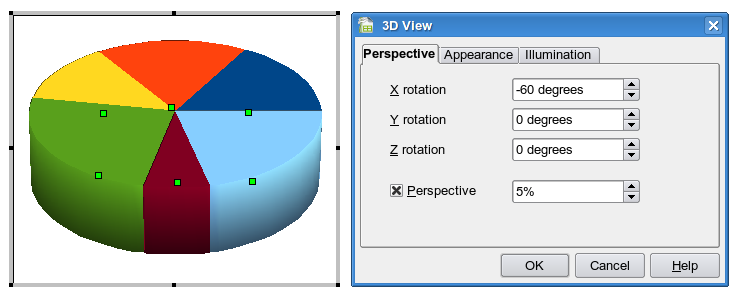
| + | Description : For charts the old 3D effects dialog is replaced by a new dialog concentrating on the features relevant for charts. | ||
| − | + | [[Image:Chart2_3D_Effects_Dialog.png]] | |
| − | + | ||
| − | + | ||
| − | + | ||
| − | + | ||
| − | + | ||
| − | + | ||
| + | * Issue : [http://www.openoffice.org/issues/show_bug.cgi?id=75176 75176] : | ||
| + | * Feature Announcement : http://graphics.openoffice.org/servlets/ReadMsg?list=features&msgNo=170 | ||
| + | * Specification : http://specs.openoffice.org/chart/Chart3DViewDialog.odt | ||
| + | * Test case specification : http://qa.openoffice.org/ooQAReloaded/TestcaseSpecifications/OpenOffice.org_2.3/Chart-2/3D_View_Dialog.html | ||
| + | * CWS : [http://eis.services.openoffice.org/EIS2/cws.ShowCWS?Path=SRC680%2Fchart2mst3 chart2mst3] integrated in SRC680m212 | ||
| − | |||
| − | |||
| − | |||
| − | |||
| − | |||
| − | |||
| − | |||
| − | = | + | = Right-angled axes option for 3D charts = |
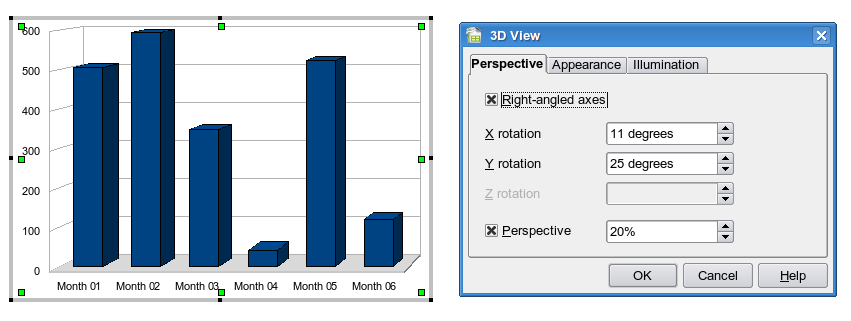
| − | + | Description : With the new right-angled axes option the user can easily ensure that the axes in a 3D chart are exactly vertical or horizontal. This simplified display looks comfortable and allows for more accurate reading. New charts are now created per default with this option. | |
| − | + | ||
| − | + | ||
| − | + | ||
| − | + | ||
| − | + | ||
| + | [[Image:Chart2_RightAngle.png]] | ||
| − | + | * Issue : [http://www.openoffice.org/issues/show_bug.cgi?id=67754 67754] | |
| − | * [http://www.openoffice.org/issues/show_bug.cgi?id= | + | * Feature Announcement : http://graphics.openoffice.org/servlets/ReadMsg?list=features&msgNo=187 |
| − | + | * Specification : http://specs.openoffice.org/chart/Chart3DViewDialog.odt | |
| − | + | * Test case specification : http://qa.openoffice.org/ooQAReloaded/TestcaseSpecifications/OpenOffice.org_2.3/Chart-2/3D_View_Dialog.html | |
| − | + | * CWS : [http://eis.services.openoffice.org/EIS2/cws.ShowCWS?Path=SRC680%2Fchart06 chart06] integrated in SRC680m219 | |
| − | + | ||
| − | + | ||
| + | = Simple 3d look: 3D-Chart looking less confusing (alternative mode) = | ||
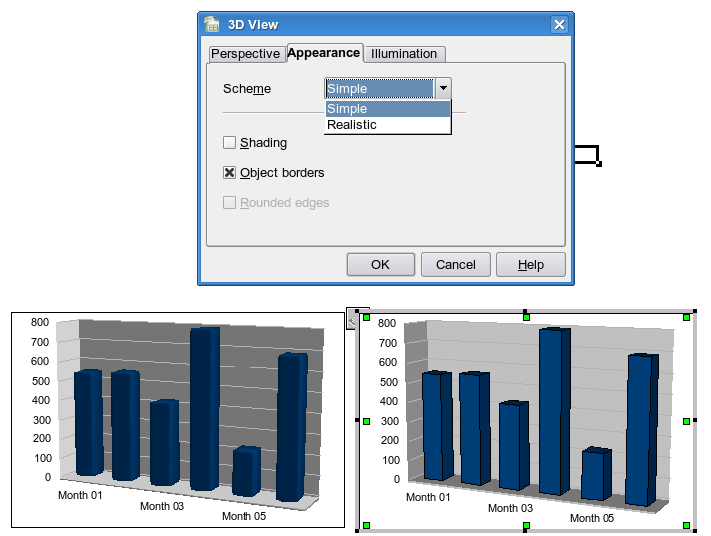
| + | Description : It is now possible to easily switch to a more simple 3D look in charts with no shading and lines on. | ||
| − | + | [[Image:Chart2_3DChartLooking.png]] | |
| − | + | ||
| − | + | ||
| − | + | ||
| − | + | ||
| − | + | ||
| − | + | ||
| + | * Issue : [http://www.openoffice.org/issues/show_bug.cgi?id=14202 14202] | ||
| + | * Feature Announcement : http://graphics.openoffice.org/servlets/ReadMsg?list=features&msgNo=171 | ||
| + | * Specification : http://specs.openoffice.org/chart/Chart3DViewDialog.odt | ||
| + | * Test case specification : http://qa.openoffice.org/ooQAReloaded/TestcaseSpecifications/OpenOffice.org_2.3/Chart-2/3D_View_Dialog.html | ||
| + | * CWS : [http://eis.services.openoffice.org/EIS2/cws.ShowCWS?Path=SRC680%2Fchart2mst3 chart2mst3] integrated in SRC680m212 | ||
| − | = | + | |
| − | * [http://www.openoffice.org/issues/show_bug.cgi?id= | + | |
| − | ** | + | = Illumination default setting = |
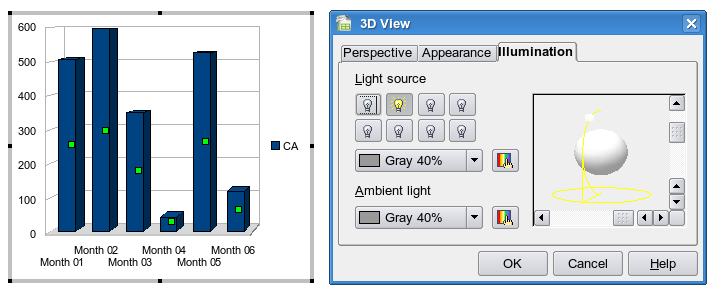
| − | ** Feature Announcement : http:// | + | * Description : The defaults for illumination were changed to fit the new simplified 3D look with right-angled axes. |
| − | + | ||
| − | + | [[Image:Chart2_Illumination.png]] | |
| − | + | ||
| − | + | * Issue : [http://www.openoffice.org/issues/show_bug.cgi?id=76430 76430] | |
| − | * [http://www.openoffice.org/issues/show_bug.cgi?id= | + | * Feature Announcement : http://graphics.openoffice.org/servlets/ReadMsg?list=features&msgNo=187 |
| − | + | * Specification : http://specs.openoffice.org/chart/Chart3DViewDialog.odt | |
| − | + | * Test case specification : http://qa.openoffice.org/ooQAReloaded/TestcaseSpecifications/OpenOffice.org_2.3/Chart-2/3D_View_Dialog.html | |
| − | + | * CWS : [http://eis.services.openoffice.org/EIS2/cws.ShowCWS?Path=SRC680%2Fchart06 chart06] integrated in SRC680m219 | |
| − | ** Test case specification : | + | |
| − | + | ||
| − | + | = Exploded 3D Pie = | |
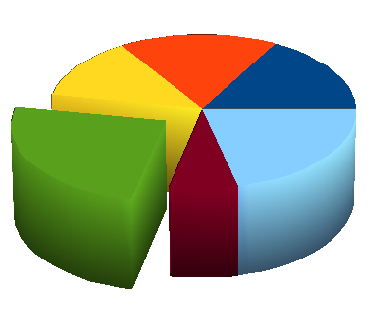
| − | + | Description : Segments of 3D pies or donuts now can be pulled out to stress single data points. The new chart types '3D exploded pie' and 'exploded donut' are offered in the new chart type dialog and wizard. | |
| − | + | ||
| − | ** Feature Announcement : http://graphics.openoffice.org/servlets/ReadMsg?list=features&msgNo=179 | + | [[Image:Chart2_Exploded3DPies.png]] |
| − | + | ||
| − | + | * Issue : [http://www.openoffice.org/issues/show_bug.cgi?id=20321 20321] | |
| − | + | * Feature Announcement : http://graphics.openoffice.org/servlets/ReadMsg?list=features&msgNo=172 | |
| − | + | * Specification : http://specs.openoffice.org/chart/wizards/ChartWizard.odt | |
| − | * [http://www.openoffice.org/issues/show_bug.cgi?id= | + | * Test case specification : http://www.openoffice.org/nonav/issues/showattachment.cgi/44973/chart2_wizard.html |
| − | + | * CWS : [http://eis.services.openoffice.org/EIS2/cws.ShowCWS?Path=SRC680%2Fchart2mst3 chart2mst3] integrated in SRC680m212 | |
| − | + | ||
| − | + | = More pretty default colors = | |
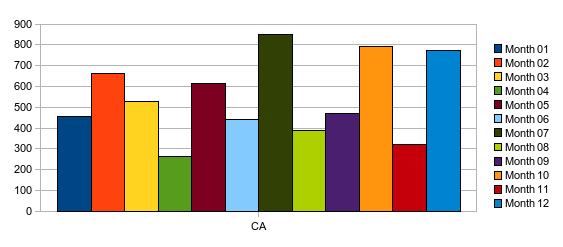
| − | + | Description : The twelve default colors used for creating new charts have changed to a set of new colors. The colors are the winner (proposal #2) of a voting where twelve different proposals have been made, to vote for. The colors have been changed in the Registry schema file Chart.xcs. They were also added to the standard color palette (standard.soc). | |
| − | + | ||
| − | + | [[Image:Chart2_DefaultColors .png]] | |
| − | * [http://www.openoffice.org/issues/show_bug.cgi?id=58161 58161] : | + | |
| + | * Issue : [http://www.openoffice.org/issues/show_bug.cgi?id=7019 7019] and [http://www.openoffice.org/issues/show_bug.cgi?id=75202 75202] | ||
| + | * Feature Announcement : http://graphics.openoffice.org/servlets/ReadMsg?list=features&msgNo=169 and http://ui.openoffice.org/servlets/ReadMsg?listName=features&msgNo=246 | ||
| + | * Specification : http://specs.openoffice.org/chart/OptionsChartColors.odt | ||
| + | * Voting : http://ui.openoffice.org/VisualDesign/OOoChart_colors_drafts.html#02 | ||
| + | * Test case specification : http://www.openoffice.org/nonav/issues/showattachment.cgi/46292/default_colors.html | ||
| + | * CWS : [http://eis.services.openoffice.org/EIS2/cws.ShowCWS?Path=SRC680%2Fchart2mst3 chart2mst3] integrated in SRC680m212 and [http://eis.services.openoffice.org/EIS2/cws.ShowCWS?Path=SRC680%2Fchart06 chart06] integrated in SRC680m219 | ||
| + | |||
| + | = Enhanced Logarithmic scales = | ||
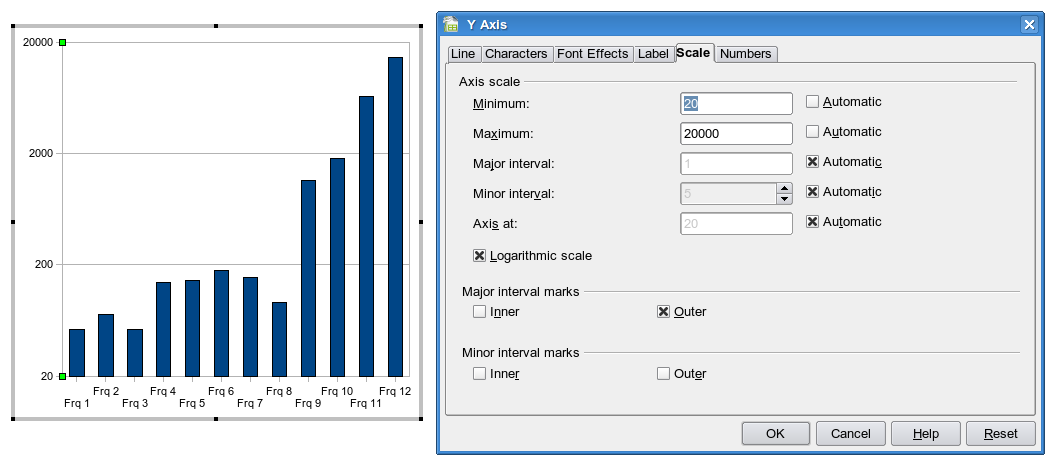
| + | Description : Logarithmic scales have been enhanced. The user is free to choose manual minimum and maximum values. Thus for example audio engineers now can display their log charts from typical 20 to 20000 Hz. | ||
| + | The major interval for logarithmic scales can now also be changed by the user. The given value is interpreted as order of magnitude (log(x1)-log(x2)), thus if you choose 3 for example you will get major tickmarks at 1 and 1 000 and 1 000 000 etc. | ||
| + | |||
| + | [[Image:Chart2_LogarithmicScale.png]] | ||
| + | |||
| + | * Issue : [http://www.openoffice.org/issues/show_bug.cgi?id=27694 27694] and [http://www.openoffice.org/issues/show_bug.cgi?id=26869 26869]: | ||
| + | * Feature Announcement : http://graphics.openoffice.org/servlets/ReadMsg?list=features&msgNo=179 | ||
| + | * Specification : http://specs.openoffice.org/chart/Chart_Scales_and_Intervals.odt | ||
| + | * Test case specification : http://www.openoffice.org/nonav/issues/showattachment.cgi/45044/tcs_chart2_Scale_and_Intervals.htm | ||
| + | * CWS : [http://eis.services.openoffice.org/EIS2/cws.ShowCWS?Path=SRC680%2Fchart2mst3 chart2mst3] integrated in SRC680m212 | ||
| + | |||
| + | |||
| + | |||
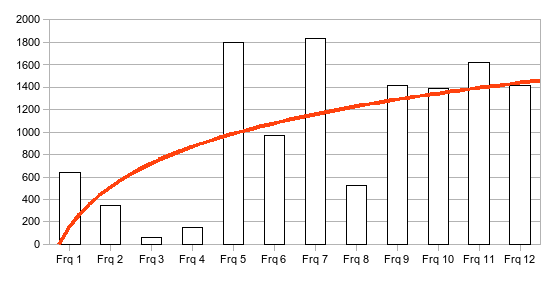
| + | = Regression curves are now also available for 2D line charts, 2D bar and column charts and 2D area charts = | ||
| + | |||
| + | [[Image:Chart2_RegressionCurves.png]] | ||
| + | |||
| + | |||
| + | = Additional sub chart types = | ||
| + | |||
| + | == 2D Lines subtype 'points only' == | ||
| + | [[Image:Chart2_2DLines.png]] | ||
| + | |||
| + | == 2D net subtype 'points only' == | ||
| + | [[Image:Chart2_2DNet.png]] | ||
| + | |||
| + | == 3D XY == | ||
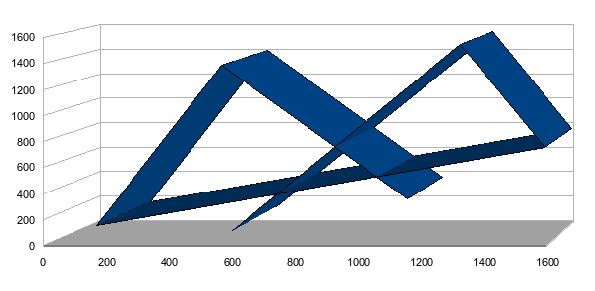
| + | [[Image:Chart2_3DXY.png]] | ||
| + | |||
| + | == 3D smooth lines == | ||
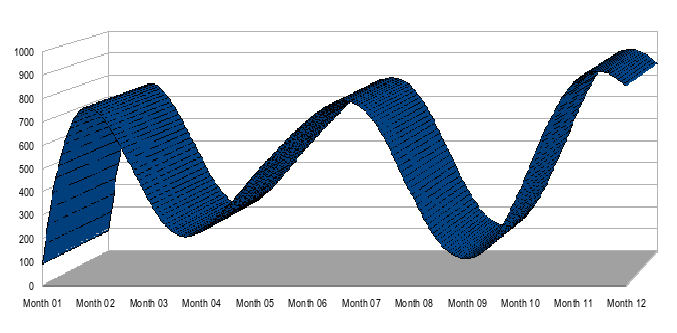
| + | [[Image:Chart2_3DSmoothLines2.png]] | ||
| + | |||
| + | == 3D donut == | ||
| + | [[Image:Chart2_3DDonut.png]] | ||
| + | |||
| + | = Enhancement of the data editor = | ||
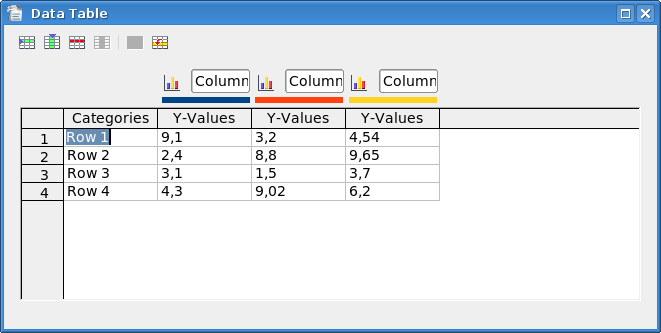
| + | * Description : For Charts that display their own data there is a dialog for editing the data. The Chart Data dialog is capable to modify, add and delete data that is used in data series and for categories. It is also possible to add and remove entire data series. All parts of a data series' data can be changed with this dialog. Charts with own data are typically those in a presentation. Although they can also appear in a spreadsheet, there, they usually use data coming from sheets | ||
| + | |||
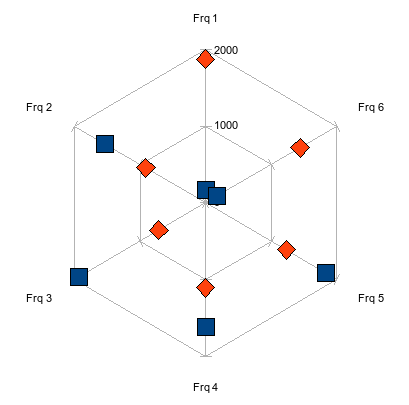
| + | [[Image:Chart2_DataEditor.png]] | ||
| + | |||
| + | * Issue : [http://www.openoffice.org/issues/show_bug.cgi?id=64824 64824] | ||
| + | * Feature Announcement : http://graphics.openoffice.org/servlets/ReadMsg?list=features&msgNo=166 | ||
| + | * Specification : http://specs.openoffice.org/chart/ChartDataDialog.odt | ||
| + | * Test case specification : http://www.openoffice.org/nonav/issues/showattachment.cgi/45116/TSC-DataDialogue.html | ||
| + | * CWS : [http://eis.services.openoffice.org/EIS2/cws.ShowCWS?Path=SRC680%2Fchart2mst3 chart2mst3] integrated in SRC680m212 | ||
| + | |||
| + | = Other features = | ||
| + | * [http://www.openoffice.org/issues/show_bug.cgi?id=58161 58161] : Easier selection of chart objects via mouse | ||
** Description : The selection of chart objects via mouse has been changed to work more predictable and usable. | ** Description : The selection of chart objects via mouse has been changed to work more predictable and usable. | ||
** Feature Announcement : http://graphics.openoffice.org/servlets/ReadMsg?list=features&msgNo=180 | ** Feature Announcement : http://graphics.openoffice.org/servlets/ReadMsg?list=features&msgNo=180 | ||
| Line 119: | Line 159: | ||
** Test case specification : http://www.openoffice.org/nonav/issues/showattachment.cgi/44968/tcs_Selection_handling.htm | ** Test case specification : http://www.openoffice.org/nonav/issues/showattachment.cgi/44968/tcs_Selection_handling.htm | ||
** CWS : [http://eis.services.openoffice.org/EIS2/cws.ShowCWS?Path=SRC680%2Fchart2mst3 chart2mst3] integrated in SRC680m212 | ** CWS : [http://eis.services.openoffice.org/EIS2/cws.ShowCWS?Path=SRC680%2Fchart2mst3 chart2mst3] integrated in SRC680m212 | ||
| − | + | ||
| − | * [http://www.openoffice.org/issues/show_bug.cgi?id= | + | |
| − | ** Description : | + | * [http://www.openoffice.org/issues/show_bug.cgi?id=30426 30426] : Enhanced automatic scaling |
| − | ** Feature Announcement : http://graphics.openoffice.org/servlets/ReadMsg? | + | ** Description : The automatic minimum and maximum values for axis have been improved thus charts look nicer. |
| − | ** Specification : http://specs.openoffice.org/chart/ | + | ** Feature Announcement : http://graphics.openoffice.org/servlets/ReadMsg?listName=features&msgNo=178 |
| − | ** Test case specification : http://www.openoffice.org/nonav/issues/showattachment.cgi/ | + | ** Specification : http://specs.openoffice.org/chart/ChartAxisAutoScaling.odt |
| + | ** Test case specification : http://www.openoffice.org/nonav/issues/showattachment.cgi/45014/tcs_chart2_auto_scaling.htm | ||
** CWS : [http://eis.services.openoffice.org/EIS2/cws.ShowCWS?Path=SRC680%2Fchart2mst3 chart2mst3] integrated in SRC680m212 | ** CWS : [http://eis.services.openoffice.org/EIS2/cws.ShowCWS?Path=SRC680%2Fchart2mst3 chart2mst3] integrated in SRC680m212 | ||
| − | + | ||
| − | * [http://www.openoffice.org/issues/show_bug.cgi?id= | + | |
| − | + | * [http://www.openoffice.org/issues/show_bug.cgi?id=60358 60358], [http://www.openoffice.org/issues/show_bug.cgi?id=70287 70287] : The Chart Menu and Toolbar were changed slightly | |
| − | + | ||
| − | + | ||
| − | + | ||
| − | + | ||
| − | + | ||
| − | + | ||
| − | + | ||
| − | + | ||
** Specification : http://specs.openoffice.org/chart/menus/MenuStructure.odt | ** Specification : http://specs.openoffice.org/chart/menus/MenuStructure.odt | ||
| − | |||
| − | |||
| − | |||
| − | |||
| − | |||
| − | |||
** Specification : http://specs.openoffice.org/chart/Toolbars.odt | ** Specification : http://specs.openoffice.org/chart/Toolbars.odt | ||
| + | ** Test case specification : http://www.openoffice.org/nonav/issues/showattachment.cgi/44858/tcs_chart2_menus.html | ||
** Test case specification : http://www.openoffice.org/nonav/issues/showattachment.cgi/44859/tcs_toolbars.html | ** Test case specification : http://www.openoffice.org/nonav/issues/showattachment.cgi/44859/tcs_toolbars.html | ||
** CWS : [http://eis.services.openoffice.org/EIS2/cws.ShowCWS?Path=SRC680%2Fchart2mst3 chart2mst3] integrated in SRC680m212 | ** CWS : [http://eis.services.openoffice.org/EIS2/cws.ShowCWS?Path=SRC680%2Fchart2mst3 chart2mst3] integrated in SRC680m212 | ||
| − | + | ||
| − | + | ||
| − | + | = Compatibility Issues = | |
| − | + | ||
| − | + | ||
| − | + | ||
| − | + | ||
| − | + | ||
| − | + | ||
| − | + | ||
| − | + | ||
| − | + | ||
| − | + | ||
| − | + | ||
| − | + | ||
| − | + | ||
| − | + | ||
| − | + | ||
| − | + | ||
| − | + | ||
| − | + | ||
| − | + | ||
* [http://www.openoffice.org/issues/show_bug.cgi?id=58457 58457] : Fileformat violation when saving Donut Charts | * [http://www.openoffice.org/issues/show_bug.cgi?id=58457 58457] : Fileformat violation when saving Donut Charts | ||
** Description : Donut charts now are written to xml according to the ODF specification. Wrong files from former versions are converted during loading. As former versions are buggy they will not be able to import the new correct files correctly. So switch to the corrected version completely when you use this chart type. | ** Description : Donut charts now are written to xml according to the ODF specification. Wrong files from former versions are converted during loading. As former versions are buggy they will not be able to import the new correct files correctly. So switch to the corrected version completely when you use this chart type. | ||
| Line 175: | Line 184: | ||
** Test case specification : -- | ** Test case specification : -- | ||
** CWS : [http://eis.services.openoffice.org/EIS2/cws.ShowCWS?Path=SRC680%2Fchart2mst3 chart2mst3] integrated in SRC680m212 | ** CWS : [http://eis.services.openoffice.org/EIS2/cws.ShowCWS?Path=SRC680%2Fchart2mst3 chart2mst3] integrated in SRC680m212 | ||
| − | + | ||
| + | |||
* [http://www.openoffice.org/issues/show_bug.cgi?id=59288 59288] : Fileformat Violation when saving manual scales for percent charts | * [http://www.openoffice.org/issues/show_bug.cgi?id=59288 59288] : Fileformat Violation when saving manual scales for percent charts | ||
** Description : Percent charts with user defined scales now are written to xml correctly. Wrong files from former versions are converted during loading. As former versions are buggy they will not be able to import the new correct files correctly. So switch to the corrected version completely when you use this kind of charts. | ** Description : Percent charts with user defined scales now are written to xml correctly. Wrong files from former versions are converted during loading. As former versions are buggy they will not be able to import the new correct files correctly. So switch to the corrected version completely when you use this kind of charts. | ||
| Line 182: | Line 192: | ||
** Test case specification : -- | ** Test case specification : -- | ||
** CWS : [http://eis.services.openoffice.org/EIS2/cws.ShowCWS?Path=SRC680%2Fchart2mst3 chart2mst3] integrated in SRC680m212 | ** CWS : [http://eis.services.openoffice.org/EIS2/cws.ShowCWS?Path=SRC680%2Fchart2mst3 chart2mst3] integrated in SRC680m212 | ||
| − | |||
| − | |||
| − | |||
| − | |||
| − | + | = Others Link = | |
* [[Feature_Freeze_Testing_2.3 | Feature Freeze Testing 2.3 ]] | * [[Feature_Freeze_Testing_2.3 | Feature Freeze Testing 2.3 ]] | ||
* http://graphics.openoffice.org/chart/whatsnewinchart2.html | * http://graphics.openoffice.org/chart/whatsnewinchart2.html | ||
| + | * [http://distribution.openoffice.org/issues/buglist.cgi?issue_type=ENHANCEMENT&issue_type=FEATURE&component=Chart&issue_status=UNCONFIRMED&issue_status=NEW&issue_status=STARTED&issue_status=REOPENED&issue_status=RESOLVED&issue_status=VERIFIED&issue_status=CLOSED&target_milestone=OOo+2.3&email1=&emailtype1=exact&emailassigned_to1=1&email2=&emailtype2=exact&emailreporter2=1&issueidtype=include&issue_id=&changedin=&votes=&chfieldfrom=&chfieldto=Now&chfieldvalue=&short_desc=&short_desc_type=allwords&long_desc=&long_desc_type=allwords&issue_file_loc=&issue_file_loc_type=substring&status_whiteboard=&status_whiteboard_type=substring&keywords=&keywords_type=anytokens&field0-0-0=noop&type0-0-0=noop&value0-0-0=&cmdtype=doit&namedcmd=Chart-Unconfirmed&newqueryname=&order=Reuse+same+sort+as+last+time&Submit+query=Submit+query List feature issues for Chart 2.3] | ||
| + | [[Category:Chart2]] | ||
Latest revision as of 09:21, 25 November 2009
Contents
- 1 Simplified creation of charts with a new Chart Wizard ( former Autoformat Chart Dialog)
- 2 Flexible source ranges
- 3 Show formula and r^2 value of regression curve in status bar and quick help
- 4 Simplify and correct the 3D-Effects dialog for charts
- 5 Right-angled axes option for 3D charts
- 6 Simple 3d look: 3D-Chart looking less confusing (alternative mode)
- 7 Illumination default setting
- 8 Exploded 3D Pie
- 9 More pretty default colors
- 10 Enhanced Logarithmic scales
- 11 Regression curves are now also available for 2D line charts, 2D bar and column charts and 2D area charts
- 12 Additional sub chart types
- 13 Enhancement of the data editor
- 14 Other features
- 15 Compatibility Issues
- 16 Others Link
Simplified creation of charts with a new Chart Wizard ( former Autoformat Chart Dialog)
Description : The chart creation procedure has been simplified to take less steps. The chart is positioned automatically and serves as live preview. A new wizard offers to select the chart type as first user action. The type can be selected on a single page. There is no need to switch between pages or scroll around anymore. The chart type dialog has been replaced thus it now equals the new first wizard page.
- Issue : 20344
- Feature Announcement : http://graphics.openoffice.org/servlets/ReadMsg?listName=features&msgNo=164
- Specification : http://specs.openoffice.org/chart/wizards/ChartWizard.odt
- Test case specification : http://www.openoffice.org/nonav/issues/showattachment.cgi/44974/chart2_wizard.html
- CWS : chart2mst3 integrated in SRC680m212
Flexible source ranges
Description : It is possible now to choose separate data ranges for each series. You can even select different x-values for different series.
- Issue : 3997
- Feature Announcement : http://graphics.openoffice.org/servlets/ReadMsg?list=features&msgNo=165
- Specification : http://specs.openoffice.org/chart/dataselection/FlexibleSourceRangeSelection.odt
- Test case specification : http://www.openoffice.org/nonav/issues/showattachment.cgi/44907/ChFlexSource.html
- CWS : chart2mst3 integrated in SRC680m212
Show formula and r^2 value of regression curve in status bar and quick help
Description : When a regression curve in a chart is selected, the status bar now shows the formula and the square of correlation coefficient R in the status bar. The same string is also used for quick help, but only in the extended version (see Tools/Options/%PRODUCTNAME/General for switching that on)
- Issue : 78442
- Feature Announcement : http://graphics.openoffice.org/servlets/ReadMsg?list=features&msgNo=185
- Specification : http://specs.openoffice.org/chart/ChartObjectNames.odt
- Test case specification : http://www.openoffice.org/nonav/issues/showattachment.cgi/46250/regression_curves.html
- CWS : chart06 integrated in SRC680m219
Simplify and correct the 3D-Effects dialog for charts
Description : For charts the old 3D effects dialog is replaced by a new dialog concentrating on the features relevant for charts.
- Issue : 75176 :
- Feature Announcement : http://graphics.openoffice.org/servlets/ReadMsg?list=features&msgNo=170
- Specification : http://specs.openoffice.org/chart/Chart3DViewDialog.odt
- Test case specification : http://qa.openoffice.org/ooQAReloaded/TestcaseSpecifications/OpenOffice.org_2.3/Chart-2/3D_View_Dialog.html
- CWS : chart2mst3 integrated in SRC680m212
Right-angled axes option for 3D charts
Description : With the new right-angled axes option the user can easily ensure that the axes in a 3D chart are exactly vertical or horizontal. This simplified display looks comfortable and allows for more accurate reading. New charts are now created per default with this option.
- Issue : 67754
- Feature Announcement : http://graphics.openoffice.org/servlets/ReadMsg?list=features&msgNo=187
- Specification : http://specs.openoffice.org/chart/Chart3DViewDialog.odt
- Test case specification : http://qa.openoffice.org/ooQAReloaded/TestcaseSpecifications/OpenOffice.org_2.3/Chart-2/3D_View_Dialog.html
- CWS : chart06 integrated in SRC680m219
Simple 3d look: 3D-Chart looking less confusing (alternative mode)
Description : It is now possible to easily switch to a more simple 3D look in charts with no shading and lines on.
- Issue : 14202
- Feature Announcement : http://graphics.openoffice.org/servlets/ReadMsg?list=features&msgNo=171
- Specification : http://specs.openoffice.org/chart/Chart3DViewDialog.odt
- Test case specification : http://qa.openoffice.org/ooQAReloaded/TestcaseSpecifications/OpenOffice.org_2.3/Chart-2/3D_View_Dialog.html
- CWS : chart2mst3 integrated in SRC680m212
Illumination default setting
- Description : The defaults for illumination were changed to fit the new simplified 3D look with right-angled axes.
- Issue : 76430
- Feature Announcement : http://graphics.openoffice.org/servlets/ReadMsg?list=features&msgNo=187
- Specification : http://specs.openoffice.org/chart/Chart3DViewDialog.odt
- Test case specification : http://qa.openoffice.org/ooQAReloaded/TestcaseSpecifications/OpenOffice.org_2.3/Chart-2/3D_View_Dialog.html
- CWS : chart06 integrated in SRC680m219
Exploded 3D Pie
Description : Segments of 3D pies or donuts now can be pulled out to stress single data points. The new chart types '3D exploded pie' and 'exploded donut' are offered in the new chart type dialog and wizard.
- Issue : 20321
- Feature Announcement : http://graphics.openoffice.org/servlets/ReadMsg?list=features&msgNo=172
- Specification : http://specs.openoffice.org/chart/wizards/ChartWizard.odt
- Test case specification : http://www.openoffice.org/nonav/issues/showattachment.cgi/44973/chart2_wizard.html
- CWS : chart2mst3 integrated in SRC680m212
More pretty default colors
Description : The twelve default colors used for creating new charts have changed to a set of new colors. The colors are the winner (proposal #2) of a voting where twelve different proposals have been made, to vote for. The colors have been changed in the Registry schema file Chart.xcs. They were also added to the standard color palette (standard.soc).
- Issue : 7019 and 75202
- Feature Announcement : http://graphics.openoffice.org/servlets/ReadMsg?list=features&msgNo=169 and http://ui.openoffice.org/servlets/ReadMsg?listName=features&msgNo=246
- Specification : http://specs.openoffice.org/chart/OptionsChartColors.odt
- Voting : http://ui.openoffice.org/VisualDesign/OOoChart_colors_drafts.html#02
- Test case specification : http://www.openoffice.org/nonav/issues/showattachment.cgi/46292/default_colors.html
- CWS : chart2mst3 integrated in SRC680m212 and chart06 integrated in SRC680m219
Enhanced Logarithmic scales
Description : Logarithmic scales have been enhanced. The user is free to choose manual minimum and maximum values. Thus for example audio engineers now can display their log charts from typical 20 to 20000 Hz. The major interval for logarithmic scales can now also be changed by the user. The given value is interpreted as order of magnitude (log(x1)-log(x2)), thus if you choose 3 for example you will get major tickmarks at 1 and 1 000 and 1 000 000 etc.
- Issue : 27694 and 26869:
- Feature Announcement : http://graphics.openoffice.org/servlets/ReadMsg?list=features&msgNo=179
- Specification : http://specs.openoffice.org/chart/Chart_Scales_and_Intervals.odt
- Test case specification : http://www.openoffice.org/nonav/issues/showattachment.cgi/45044/tcs_chart2_Scale_and_Intervals.htm
- CWS : chart2mst3 integrated in SRC680m212
Regression curves are now also available for 2D line charts, 2D bar and column charts and 2D area charts
Additional sub chart types
2D Lines subtype 'points only'
2D net subtype 'points only'
3D XY
3D smooth lines
3D donut
Enhancement of the data editor
- Description : For Charts that display their own data there is a dialog for editing the data. The Chart Data dialog is capable to modify, add and delete data that is used in data series and for categories. It is also possible to add and remove entire data series. All parts of a data series' data can be changed with this dialog. Charts with own data are typically those in a presentation. Although they can also appear in a spreadsheet, there, they usually use data coming from sheets
- Issue : 64824
- Feature Announcement : http://graphics.openoffice.org/servlets/ReadMsg?list=features&msgNo=166
- Specification : http://specs.openoffice.org/chart/ChartDataDialog.odt
- Test case specification : http://www.openoffice.org/nonav/issues/showattachment.cgi/45116/TSC-DataDialogue.html
- CWS : chart2mst3 integrated in SRC680m212
Other features
- 58161 : Easier selection of chart objects via mouse
- Description : The selection of chart objects via mouse has been changed to work more predictable and usable.
- Feature Announcement : http://graphics.openoffice.org/servlets/ReadMsg?list=features&msgNo=180
- Specification : http://specs.openoffice.org/chart/ChartSelectionHandling.odt
- Test case specification : http://www.openoffice.org/nonav/issues/showattachment.cgi/44968/tcs_Selection_handling.htm
- CWS : chart2mst3 integrated in SRC680m212
- 30426 : Enhanced automatic scaling
- Description : The automatic minimum and maximum values for axis have been improved thus charts look nicer.
- Feature Announcement : http://graphics.openoffice.org/servlets/ReadMsg?listName=features&msgNo=178
- Specification : http://specs.openoffice.org/chart/ChartAxisAutoScaling.odt
- Test case specification : http://www.openoffice.org/nonav/issues/showattachment.cgi/45014/tcs_chart2_auto_scaling.htm
- CWS : chart2mst3 integrated in SRC680m212
- 60358, 70287 : The Chart Menu and Toolbar were changed slightly
- Specification : http://specs.openoffice.org/chart/menus/MenuStructure.odt
- Specification : http://specs.openoffice.org/chart/Toolbars.odt
- Test case specification : http://www.openoffice.org/nonav/issues/showattachment.cgi/44858/tcs_chart2_menus.html
- Test case specification : http://www.openoffice.org/nonav/issues/showattachment.cgi/44859/tcs_toolbars.html
- CWS : chart2mst3 integrated in SRC680m212
Compatibility Issues
- 58457 : Fileformat violation when saving Donut Charts
- Description : Donut charts now are written to xml according to the ODF specification. Wrong files from former versions are converted during loading. As former versions are buggy they will not be able to import the new correct files correctly. So switch to the corrected version completely when you use this chart type.
- Feature Announcement : http://graphics.openoffice.org/servlets/ReadMsg?list=features&msgNo=175
- Specification : --
- Test case specification : --
- CWS : chart2mst3 integrated in SRC680m212
- 59288 : Fileformat Violation when saving manual scales for percent charts
- Description : Percent charts with user defined scales now are written to xml correctly. Wrong files from former versions are converted during loading. As former versions are buggy they will not be able to import the new correct files correctly. So switch to the corrected version completely when you use this kind of charts.
- Feature Announcement : http://graphics.openoffice.org/servlets/ReadMsg?list=features&msgNo=176
- Specification : --
- Test case specification : --
- CWS : chart2mst3 integrated in SRC680m212
