Organization Charts, Flow Diagrams, and More
- Copyright
- Introducing Draw
- Drawing Basic Shapes
- Working with Objects and Object Points
- Changing Object Attributes
- Combining Multiple Objects
- Editing Pictures
- Working with 3D Objects
- Tips and Tricks
- Organization Charts, Flow Diagrams, and More
- Advanced Draw Techniques
This is Chapter 9 of the OpenOffice.org 3 Draw Guide, produced by the OOoAuthors group.
A PDF of this chapter is available from this wiki page.
Contents
Drawing An Organization Chart
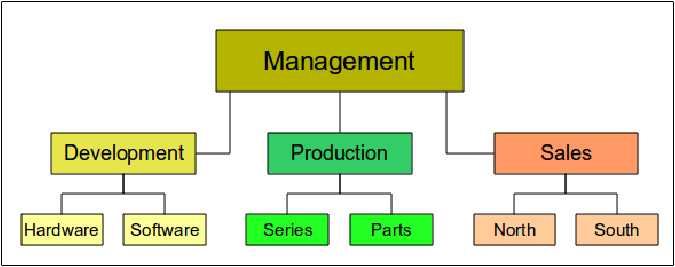
Even though Draw does not have an organization chart toolbar, you can draw these charts by drawing rectangles and connector lines (see Figure 1). You can indicate hierarchies by using a color progression from dark to light tones. Be sure your color choices maintain a good contrast between text color and background so that you can easily read the printed diagram.
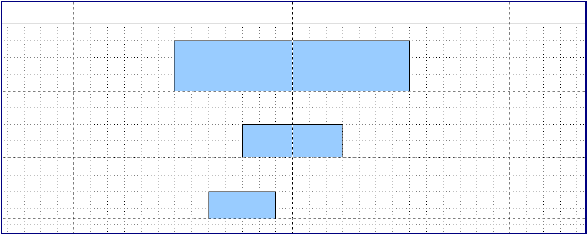
Before you begin, prepare a setup page or draft, with snap lines, to assist in drawing the various hierarchies, responsibility paths, and typical boxes that you will use in drawing the chart.
Place and dimension the individual boxes according to the size of the overall chart. The exact size (particularly width), position, and color will be fixed later. It is sometimes easier to draw only one box per level; later you can copy and paste this box and then move the copies to the desired positions. Using styles can also be helpful; see the relevant section in Chapter 4 (Changing Object Attributes).
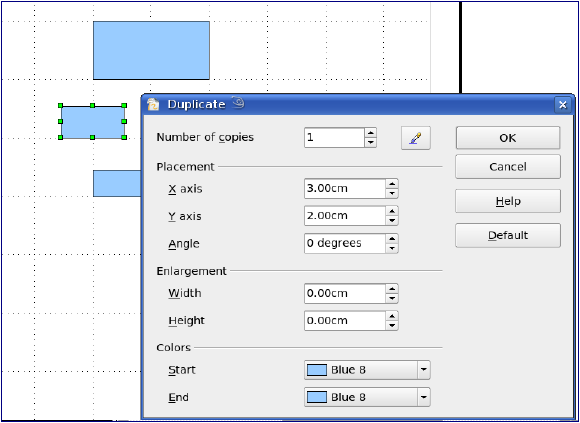
You can also select one or more boxes and use Edit > Duplicate to make copies (see Figure 3). The spacing of the duplicated objects relative to the original can be controlled using the placement fields for the X and Y axes. Note that positive values for X and Y are to the right and downwards from the original object.
Which replication technique you use is up to you. The draft for the example in this chapter should look similar to that in Figure 4.
The next step is to add text to the boxes. It is easiest to insert it as a text element within the box as described in Chapter 2 (Drawing Basic Shapes). Activate the [ ] icon on the Options toolbar and then doubleclick the box to enter text into it. Alternatively, select the box and press F2. You should then see a blinking cursor in the box and the Text Formatting toolbar should be visible.
Set the text formatting and type the text. Depending on the length and format of the text, you may need to adjust the size of the box and the spacing to neighboring boxes or else change the formatting of the text to fit the box. Adjustments can be made initially with the mouse and then fine-tuned with the Position and Size dialog.
Now set up the fill colors and save the drawing. The connections between the boxes are not drawn with ordinary lines but with Draw’s connectors. How to draw these connectors and add text to them is described below in “Glue points and connectors”.
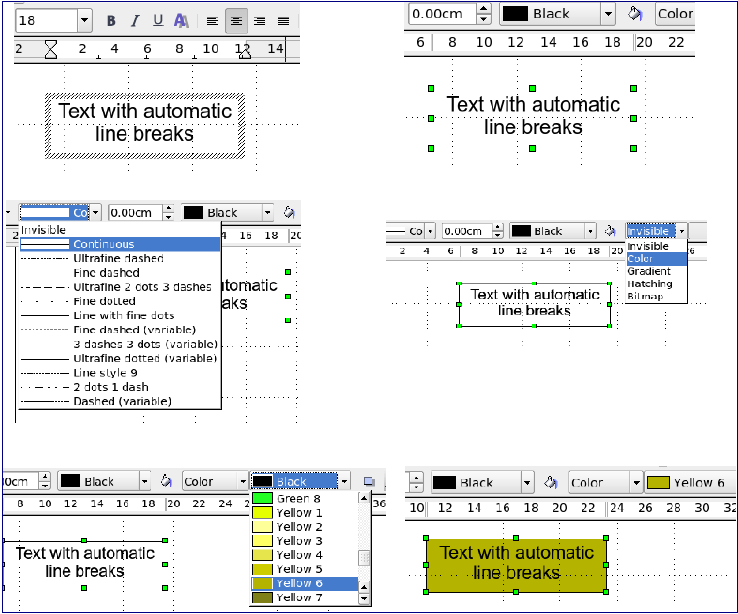
You can use dynamic text frames instead of boxes. These have the advantage of automatic line breaks. Figure 5 shows the sequence of text input into a frame, adding borders, and setting the background color.
Drawing A Flow Diagram
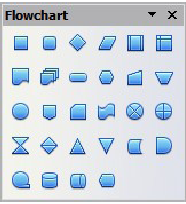
For drawing flow diagrams (also known as flowcharts), Draw offers a separate toolbar; click the flowchart icon [] on the main Drawing toolbar.
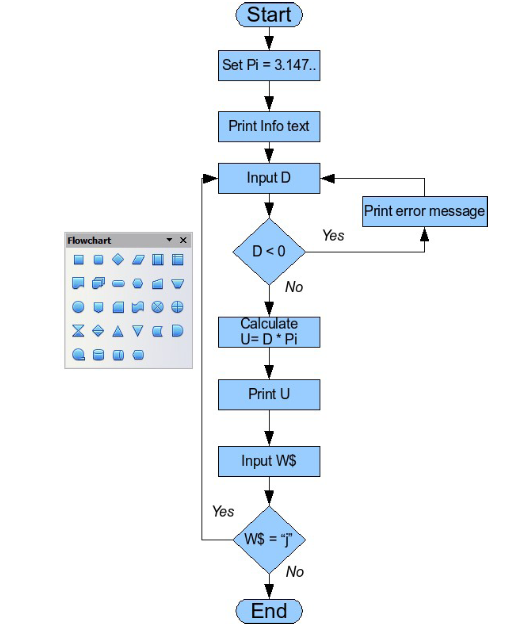
The easiest way to draw a flowchart is to follow the same setup procedure as for organization charts. Select the symbols from the toolbar and drag them into position as described in Chapter 2 (Drawing Basic Shapes). See Figure 7 for an example of a typical flowchart.
The individual symbols must be exactly positioned if the connectors joining them are to form a vertical line. The midpoints of all the symbols that lie in a vertical straight line should have the same X coordinate and those on the same level on a horizontal line should have the same Y coordinate.
Select the shapes that are to lie in a vertical straight line and center them with Modify > Alignment > Centered. For those on a horizontal line, select the shapes and center them with Modify > Alignment > Center. You can also set snap lines if you need several vertical lines.
After adding text and setting the fill color, you can join individual symbols together and add text to the connectors. This technique is described in the next section.
Glue Points and Connectors
These elements were briefly introduced in Chapter 2 (Drawing Basic Shapes). This section describes how to use them.
Connectors are lines or arrows whose ends automatically dock to a connection or glue point on an object. Connectors are particularly useful when drawing organization charts, flow diagrams, and mindmaps. The connecting lines between the symbols remain intact even when the latter are moved or rearranged.
The connector toolbar
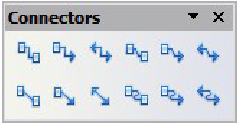
Click the [] button on the Draw toolbar to open the Connectors toolbar (Figure 8).
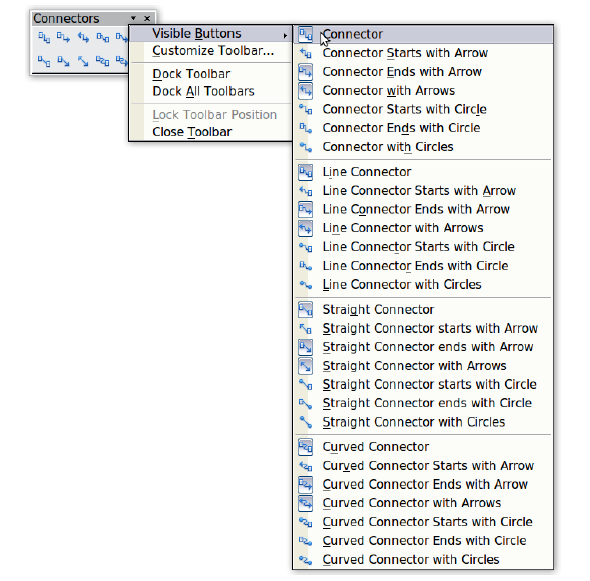
If the type of connector you want is not shown, click on the [] in the Connectors toolbar. In the list that appears, click on Visible buttons (Figure 9) to open a menu from which you can activate additional types of connector.
